Percentage Change in Numerical Aptitude Tests
The topic of percentages is one of the most important topics to revise for numerical aptitude tests. Occupational psychologists use such mathematical functions as psychometric measures to gauge numerical aptitude of candidates. At times test takers may find these operations challenging especially when percentages are incorporated into data interpretation questions. For example, you may be required to inspect graph, chart or diagram and infer the greatest or lowest percentage change for particular set of data. Don’t be daunted by complexity of such questions but rather come to terms with these. You can study the below paragraphs which provide useful advice and break down the key concepts in an easy and digestible format.
 |
How to work out percentage change
The basic method to carry out operations related to percentage change i.e. percent increase between two values A and B could be written as follows (B – A) / A x 100 whereas (A – B) / A x 100 would represent decrease. If you have some kind of familiarity with such operations have a go and try to get the below question right within 60 seconds.
 |
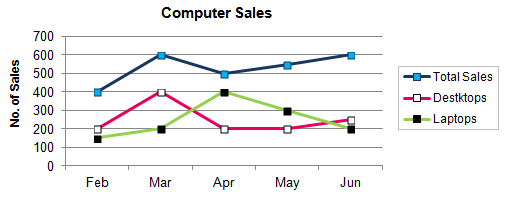
Which month represents the greatest percentage change in desktop sales compared to previous months?
Any luck on the above? Note that you don’t have to use calculator to work this out. Visually inspect data and you will see that the greatest percent change in desktop computer sales took place between the month of February and March. The question may be challenging particularly for new starters. Note that between second and third month number of sales increased by 200 whereas between the third and fourth month sales went back to original level. Remember, in percentage terms this will not result in the same outcome.
You can check this simply by finding out relative increase and decrease between particular months. If you are not familiar how to work this out then refer to tutorial on numerical percentage increase and decrease to see how to proceed with such calculations. In the above you will find increase of 100% and decrease of 37.5%. Hence, greater proportional change occurred between February and March. Nevertheless, eyeballing the data may be all you need to do in order to answer the question. Our numerical mental arithmetic section will provide you further examples of visual data analysis in the scope of numerical aptitude tests.
To further demonstrate percentage change in numerical reasoning test questions try to work out between which period laptop sales assumed the lowest relative change. Again, you may argue that between second and third month as the trades represent the lowest difference however this is not true. The lowest proportional change of laptops was recorded during April and May where number of computers fall down by 25% compared to other periods. You can work this out as follows: (400 – 300) / 400 x 100.
Quick tips
To give you a tip for speeding up your computations and calculating similar questions don’t input the numbers into your calculator but rather make in your head as many mental computations as you can. For example, you can easily calculate the difference between two values. In the above case, 400 and 300 and then work out on calculator only division 100/400. To convert decimal to percentage you can perform multiplication mentally by simply shifting the coma to by two decimal places.
Keep these steps in mind during your practice and make it habit to use shortcuts by working out as many calculations in your head as possible. Remember, the more you practice the more you will become swift in performing mental steps.

